Data Engineering Project
End-to-End Data Pipeline & BI Dashboard
Automated Superstore sales data pipeline from raw CSV ingestion to PostgreSQL analytics and Power BI dashboard reporting.
Business Problem
This project simulates an e-commerce reporting workflow that answers business questions around revenue trends, top revenue-generating products, regional performance, and active customers.
Pipeline Architecture
CSV data source -> Python extract, validate, and transform scripts -> PostgreSQL table -> SQL analysis -> BI dashboard.
Workflow
- Extract raw Superstore CSV data and detect file encoding before loading it into pandas.
- Validate data quality by checking missing values, duplicates, and required schema columns.
- Transform the dataset by converting order dates, removing duplicates, and creating a Revenue column.
- Load the cleaned dataset into PostgreSQL table sales_data.
- Run SQL analysis for monthly revenue, top products, revenue by region, total customers, total orders, and active customers.
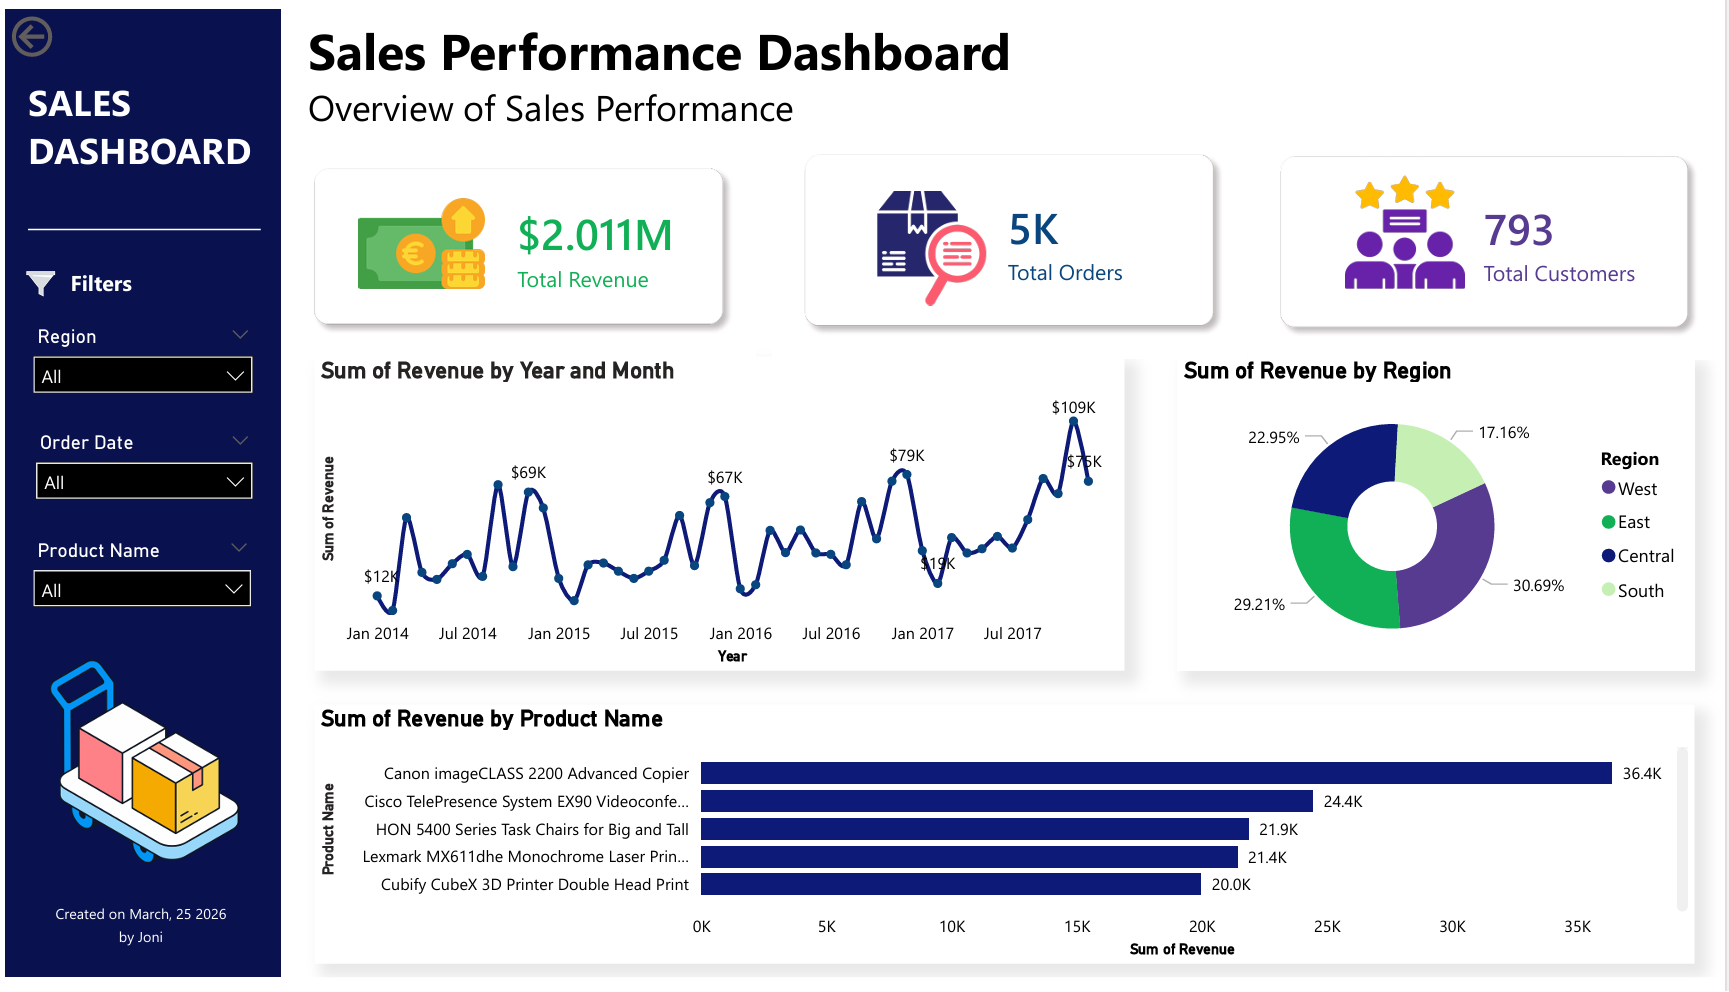
- Build a dashboard with KPIs, revenue trend, regional distribution, and top product performance.
Key Features
- Modular Python pipeline using separate extract, validate, transform, load, and logger scripts.
- Production-like logging to track execution flow, data shape, detected encoding, warnings, and load status.
- Data validation rules for missing values, duplicate records, required columns, and negative revenue detection.
- BI dashboard showing total revenue, total orders, total customers, monthly revenue, revenue by region, and top products.
Result
The pipeline processed 9,994 Superstore records, generated a cleaned dataset, loaded it into PostgreSQL, and produced dashboard-ready insights including revenue trend, customer count, order volume, regional revenue split, and top-performing products.
Repository
The full source code, SQL queries, dashboard file, dataset folders, and pipeline logs are available on GitHub.
View on GitHub